
Figure 2.4.1 Linear Plot of Cp versus Time

return to the Course index
previous | next
Pharmacokinetic data involves models with rate processes. The most simple of these would be a single first order decline described with a single exponential term. We may use an equation such as:
Equation 2.4.1 Concentration (Cp) versus time
to describe drug concentrations after an IV bolus dose. These data are drawn as three graphs on this page. The first graph is a linear (or Cartesian) plot of the data versus time. Notice the smooth decline in concentration with time.
Figure 2.4.1 Linear Plot of Cp versus Time
Click on the figure to view the interactive graph
The second graph is a plot of the natural log (ln) of the concentration values versus time. Now we get a straight line graph. You might try 'rearranging' the equation above to verify that a straight line is to be expected.

Figure 2.4.2 Linear Plot of ln(Cp) versus Time
Click on the figure to view the interactive graph
The third graph is on different paper. This is semi-log graph paper. On this graph paper the scale on the y-axis is proportional to the log of the number not the number itself, like the scale on the slide rule on the previous page. Notice that the distance from 1 to 2 is the same as the distance from 2 to 4 or from 4 to 8. Again, we have a straight line but without the need to calculate the natural log of each number.

Figure 2.4.3 Semi-log Plot of Cp versus Time
Click on the figure to view the interactive graph
Example use of semi-log graph paper: Plot the data, draw a line "through the data", and calculate the slope of the line.
| Table 2.4.1 Example Cp versus Time Data | |||||||
| Time (hr) | 1 | 2 | 4 | 8 | 12 | ||
| Cp (mg/L) | 20 | 15 | 6.8 | 3.2 | 1.3 | ||

Figure 2.4.4 Semi-log Plot of Cp versus Time
A best-fit line is drawn through the data points and extended to the extremes of the graph paper (for better accuracy). Values for Cp1 and Cp2 are read from the y-axis and t1 and t2 values are read from the x-axis. These values can be used to estimate a value for the slope of the line and also the rate constant for the drug elimination. From the Y-axis the first point is 0, 22.8 and from the X-axis the second point is 12.8, 1 (in the format x-value, y-value). Always try to use the extremes of the line for the best accuracy.
| From Figure 2.4.4 | Value |
| Cp1 | 22.8 |
| Cp2 | 1.0 |
| t1 | 0 |
| t2 | 12.8 |
The slope can be calculated using the equation:
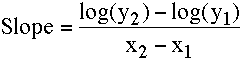
Equation 2.4.2 Slope of the line on a semi-log plot
This equation uses logarithms with base 10 for the calculation of slope.
Thus the slope of the line in Figure 2.4.4 is: [log(1.0) - log(22.8)]/(12.8 - 0) = (0.000 - 1.358)/12.8 = - 0.106 hr-1
In the study of pharmacokinetics first order rate processes and rate constants are common. When the rate constant, k, is calculated from the slope drawn on a semi-log plot, k is found to equal to -slope • 2.303 [Note ln(10) = 2.303]. Thus, the rate constant is calculated as -slope x 2.303. The calculation of k is easier with calculators (etc.) if you use ln (logarithm with base 'e') in the calculation. At the same time you can change the sign by calculating the numerator as ln(Cp1) - ln(Cp2). Thus k can be calculated using the equation:
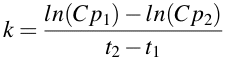
Equation 2.4.3 Equation for estimating First Order Rate Constants
Thus k = [ln(22.8) - ln(1.0)]/(12.8 - 0) = [3.127 - 0.000]/12.8 = 3.127/12.8 = 0.244 hr-1
We can perform this calculation using a different approach. Remember when I was talking about using logarithms to do multiplication and division. We can use that approach to re-arrange Equation 2.4.3. Therefore instead of subtracting the two logarithms we can divide one by the other and take the log of the quotient.
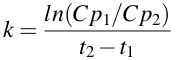
Equation 2.4.4 Equation for estimating k
Although I prefer to use the approach in Equation 2.4.3 the advantage of the approach in Equation 2.4.4 is that you don't have to deal with a double negative when Cp2 is less than one and you only need to take one ln value. For example, if Cp1 and Cp2 were 12.5 and 0.13 at 0 and 12 hours, respectively. Using Equation 2.4.3 gives k = [ln(12.5) - ln(0.13)]/12 = [2.526 - -2.040]/12 = [2.526 + 2.040]/12 = 4.566/12 = 0.381 hr-1. Using Equation 2.4.4 gives k = ln(12.5/0.13)/12 = ln(96.15)/12 = 4.566/12 = 0.381 hr-1. Note, each approach gives the same answer.
Click the arrow to play the movie
Try them out if you need practice graphing data and calculating intercept and slope in these graphs.
![]()
Material on this website should be used for Educational or Self-Study Purposes Only
Copyright © 2001 - 2026 David W. A. Bourne (david@boomer.org)
 | A game to aid recognizing brand versus generic drug names See how many names you can catch before you run out of lives |
|