
Figure 4.14.1 Plot of Cp versus Time on Semi-log Graph Paper After an I.V. Bolus Dose of 500 mg.
return to the Course index
previous | next
| Time (hr) | 1 | 2 | 3 | 4 | 6 | 8 | 10 |
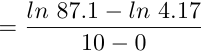
| Cp (mcg/ml) | 72 | 51 | 33 | 20 | 14 | 9 | 4 |
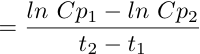
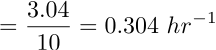
Plot the data on semi-log graph paper (Figure 4.14.1) and determine Cp1, Cp2, t1 and t2.
Figure 4.14.1 Plot of Cp versus Time on Semi-log Graph Paper After an I.V. Bolus Dose of 500 mg.
 |
|
 |
|
 |
and

Figure 4.14.2 V from dose and Cp0
and
Equation 4.12.3 Clearance from kel and V

Figure 4.5.1 Linear plot of ln(Cp) versus time
Click on the figure to view the interactive graph
![]()
Material on this website should be used for Educational or Self-Study Purposes Only
Copyright © 2001 - 2026 David W. A. Bourne (david@boomer.org)
 | Pharmacy Math Part Two A selection of Pharmacy Math Problems |
 |