Equation 6.6.1 Drug Concentration during an IV Infusion
return to the Course index
previous | next
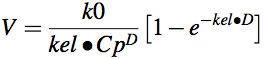
Remember that the equation for plasma concentration versus time during an IV infusion is:
Equation 6.6.1 Drug Concentration during an IV Infusion
If the infusion is continued indefinitely then the plasma concentration approaches a steady state plasma concentration.

If however the infusion is stopped the plasma concentration can be expected to fall.
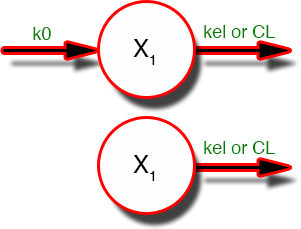
Figure 6.6.1 During and After an IV Infusion - One Compartment Model
The scheme shown to represent 'after the infusion is stopped' is the same as that for the bolus injection.
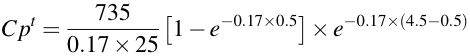
The equation for drug concentration versus time during an IV infusion is shown above as Equation 6.6.1. At the end of the infusion period when t = D the plasma concentration can be calculated using Equation 6.6.2.
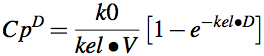
Equation 6.6.2 Concentration at the End of an IV Infusion
Once the infusion is stopped all we have is first order elimination.
Then
where t is time counted from the start of the infusion. Thus t - D is the time since the end of the infusion. Then
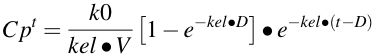
Equation 6.6.4 Concentration during and after an IV Infusion
Equation 6.6.4 can be used as shown when t is greater than D (that is for drug concentrations after the infusion has stopped). Also, if t is less than or equal to D you should set D = t before using the equation. In this way the term e-kel * (t-D) becomes equal to 1 and can be dropped from the equation and the equation reverts to Equation 6.6.1.

Figure 6.6.2 Linear Plot of Cp versus Time for Interrupted Infusion. Showing Mono exponential Rise and Fall
Click on the figure to view the interactive graph
Figure 6.6.3 Semi-log Plot of Cp versus Time. NOTE: Intercept is not Cp0
Click on the figure to view the interactive graph
![]()
Thus 4 hours after the infusion was stopped the drug concentration has fallen to half the value at the end of the infusion. Did you remember that the drug half-life was 4 hours.
| Time (hr) | 3 | 5 | 9 | 12 | 18 | 24 |
| Cp (mg/L) | 12 | 9 | 8 | 5 | 3.9 | 1.7 |
Figure 6.6.4 Plot of Cp versus Time after a Two-Hour Infusion
The red line drawn through the data points and back to the Y-axis represents the best-fit line.
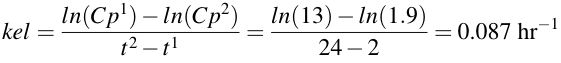
Rearranges to
![]()
|
Calculator 6.6.1 Calculate kel and V given post infusion Cp versus time data
|

Figure 6.5.1 Analysis of Plasma Concentration versus Time Data After IV Infusion Administration
Click on the figure to view the interactive graph
First try simulating concentration versus time after an IV bolus: Dose = 250 mg; D = 0 hr (IV Bolus); kel = 0.123 hr-1; V = 25 L. Contrast this with an IV infusion of the same dose over an infusion duration of 1 or 2 hours. Explore the problem as a Linear Plot - Interactive graph Winter 2004.
For practice try estimating various parameter values from post infusion data. Compare your answers with the computer! These problems include graphing post infusion drug concentration data on semi-log graph paper and estimating parameters from the slope and intercept of the best-fit line.
![]()
Material on this website should be used for Educational or Self-Study Purposes Only
Copyright © 2001 - 2026 David W. A. Bourne (david@boomer.org)
 | A game to aid recognizing drug structures See how many structures you can name before you run out of lives |
|