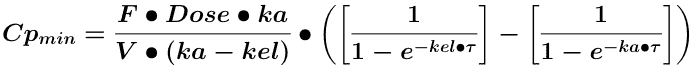
Equation 15.3.1 Cpmin after Many Oral Doses - Version 1
return to the Course index
previous | next
Equation 15.3.1 Cpmin after Many Oral Doses - Version 1
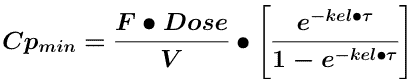
This can be further simplified if we assume that the subsequent doses are given after the plasma concentration has peaked and e-ka • τ is close to zero. That is the next dose is given after the absorption phase is complete.
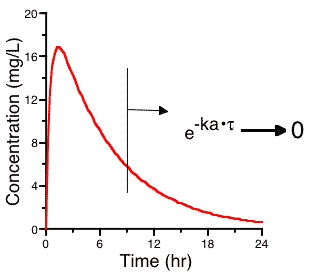
Figure 15.3.1 Plot Cp versus Time after a Single Dose showing Possible Time of Second Dose
Cpmin then becomes:
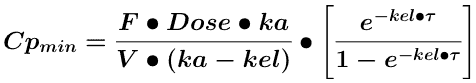
Equation 15.3.2 Cpmin after Many Oral Doses - Version 2
The relationship between loading dose and maintenance dose and thus drug accumulation during multiple dose administration can be studied by looking at the ratio between the minimum concentration at steady state and the concentration at the end of the first dosing interval,τ, after the first dose. [Assuming e-ka • τ is close to zero].
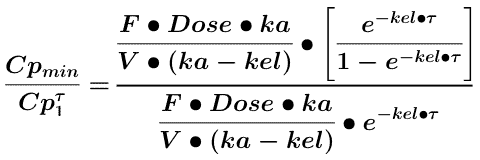
Equation 15.3.3 Ratio Between Cp after First and Last Dose
Which can be simplified to give:
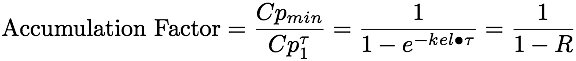
Equation 15.3.4 Ratio Between Cp after First and Last Dose
This turns out to be the same equation as for the multiple IV bolus doses. Therefore we can estimate a loading dose just as we did for an IV multiple dose regimen.
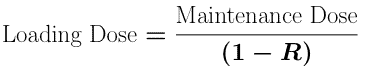
Equation 15.3.5 Loading Dose Equation
This equation holds if each dose is given after the absorption phase of the previous dose is complete.
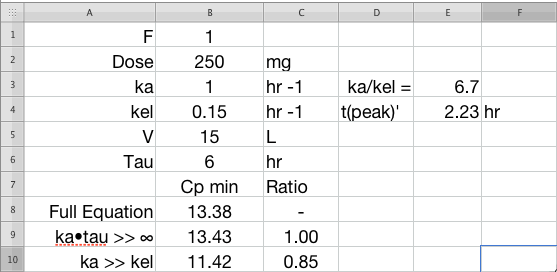
We can further simplify Equation 15.3.2 when ka is high if we assume that ka >> kel then (ka - kel) is approximately equal to ka and ka/(ka - kel) is approximately equal to one.
Equation 15.3.6 Cpmin after Many Oral Doses - Version 3
Equation 15.3.6 is an even more extreme simplification. However, it can be very useful if we don't know the ka value but we can assume that absorption is reasonably fast. Equation 15.3.6 will tend to give concentrations that are lower than those obtained with the full equation (Equation 15.3.1). Thus any estimated fluctuation between Cpmin and Cpmax will be overestimated using the simplified equation.
Click on the figure
to download and use this Excel spreadsheet
Material on this website should be used for Educational or Self-Study Purposes Only
Copyright © 2001 - 2026 David W. A. Bourne (david@boomer.org)
 | Pharmacy Math Part Two A selection of Pharmacy Math Problems |
 |