Equation 15.4.1 Average Cp for a Dosing Interval at Steady State
return to the Course index
previous | next
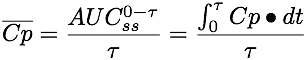
The average plasma concentration is defined as the area under the plasma concentration versus time curve during the dosing interval at steady state divided by the dosing interval.
Thus:
Equation 15.4.1 Average Cp for a Dosing Interval at Steady State

Figure 15.4.1 Plot of Cp versus Time after Multiple Oral Administration showing AUC at Steady State
Since the AUC during one dosing interval at steady state is the same as the AUC from zero to infinity after the first dose.
The AUC (first dose) from the equations developed during the Wagner-Nelson derivation or from the clearance (kel • V) equation is given as Equation 15.4.2.
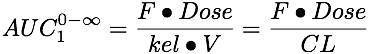
Equation 15.4.2 AUC Equation
Equation 15.4.3 for the average concentration at steady state can be obtained from Equation 15.4.1 and 15.4.2 .
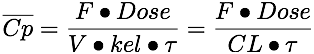
Equation 15.4.3 Average Cp for a Dosing Interval at Steady State
An interesting result of this equation is that we get the same average plasma concentration whether the dose is given as a single dose every dosing interval, τ, or is subdivided into shorter dosing intervals. For example 300 mg every 12 hours will give the same average plasma concentration as 100 mg every 4 hours. However, the difference between the maximum and minimum plasma concentration will be larger with less frequent dosing.

We could now calculate the loading dose
![]()
To get some idea of the fluctuations in plasma concentration we could calculate the Cpmin value.
Assuming that ka >> kel and that e-ka • τ approaches 0 we can use Equation 26.2.6.
Therefore the plasma concentration would probably fluctuate between 7 and 23 mg/L (very approximate) with an average concentration of about 15 mg/L. [23 = 15 + (15 - 7), i.e. high = average + (average - low), very approximate!].
The ![]() would be the same
would be the same
Thus the plasma concentration would fluctuate between about 10.4 to 20 with an average of 15 mg/L, Figure 15.4.2. The exact equation was used for the calculation in Figure 15.4.2.

Figure 15.4.2 Figure Illustrating Cpmax, Cpmin and Cp(average)
With F = 1.0, V = 30 liter, t1/2 = 6 hours or kel = 0.693/6 = 0.116 hr-1, a dose of 600 mg given every 12 hours will achieve an average plasma concentration of approximately 15 mg/L. Try simulating this regimen and also the alternate regimen of 1200 mg very 24 hours and 300 mg every 6 hours. Which regimen gives the least variation between Cpmax and Cpmin? Explore the problem as a Plot - Interactive graph.
Carbamazepine is a drug which can induce its own metabolism during the first few days of therapy (Hawkins Van Tyle and Winter, 2004). After the first dose, carbamazepine pharmacokinetic parameters include F = 0.8, V = 1.4 L/hr, CL = 0.028 L/Kg/hr. After 3 to 5 days carbamazepine metabolism is induced such that the CL becomes 0.064 L/Kg/gr. For a 70 Kg patients pre-induction (first-dose) parameter values are kel = 0.02 hr-1 and V = 100 L. After induction the kel changes to 0.045 hr-1. Dose adjustment during the first few days can be difficult. Using post induction parameters for initial dosage regimen could cause toxic concentrations. For example, try the simulation again with a dose regimen of 600 mg every 12 hours with both pre and post induction kel values. The typical therapeutic plasma concentration range is 4 - 12 mg/L. Explore the problem as a Plot - Interactive graph.
Theophylline is marketed in a number of oral dosage forms. Rapid release tablets generally are rapidly and completely absorbed with F close to 1.0 and ka values above 2 hr-1. The apparent volume of distribution is approximately 0.5 L/Kg (ideal body weight, IBW). Average values of theopylline clearance approximate 0.04 L/Kg/hr (based on IBW). A number of factors can influence this average clearance value. For example; smoking x 1.6, cimetidine co-administration x 0.6, phenytoin co-administration 1.6, congestive heart failure x 0.5 (depending on status), cystic fibrosis x 1.5, hepatic cirrhosis x 0.5. Considering a 70 Kg (IBW) non-smoker patient the expected V and kel might be 35 L and 0.08 hr-1. For a patient that smokes the kel would be expected to be approximately 0.125 hr-1. Try adjusting the parameter values according to these covariates and adjust the dosing regimen to maintain appropriate therapeutic concentrations. Explore the problem as a Plot - Interactive graph.
Material on this website should be used for Educational or Self-Study Purposes Only
Copyright © 2001 - 2026 David W. A. Bourne (david@boomer.org)
 | An iPhone app that allows the input of up to four locations (latitude and longitude) and provides the user's distance from each location |
|