Figure 16.3.1 Drug Concentration before, during and after Low Flux Dialysis
return to the Course index
previous | next
This technique is particularly important with drugs which:
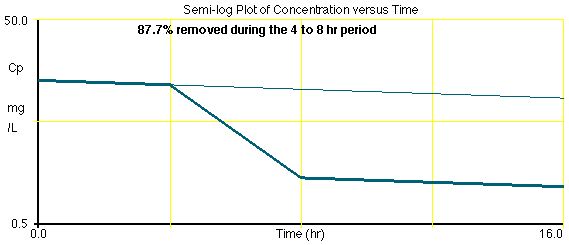
A simulation of drug concentration with and without dialysis is shown in Figure 16.3.1.
Figure 16.3.1 Drug Concentration before, during and after Low Flux Dialysis
Click on the figure to view the interactive graph
Low flux hemodialysis will readily remove molecules smaller than 500 Dalton. As the molecular weight increases to approximately 1000 Dalton the amount removed steadily decreases to insignificant. Thus clearance by hemodialysis falls from a maximum of about 4 L/hr to near zero with higher molecular weight compounds. Protein binding, represented by the fraction unbound (fu) will cause a proportional decrease in the hemodialysis clearance. Hemodialysis clearance is converted to a rate constant by dividing by the apparent volume distribution. This rate constant is added to the patient's elimination rate constant to give the increased, apparent rate constant during hemodialysis. As can be seen in Figure 16.3.1 this can cause an increased removal of a drug.
| Molecular Weight | CLHemodialysis |
|---|---|
| Less than or equal to 500 Dalton | fu x 4.0 L/hr |
| 500 to 1000 Dalton | |
| Greater than 1000 Dalton | 0.0 L/hr |
This can be useful in cases where the concentration is too high but it can also complicate the maintenance of therapeutic concentrations. In Chapter 14 and 15 drug dosage regimens were calculated using elimination rate constant and volume of distribution. Hemodialysis can mean a significant increase in the amount of drug removed during the dialysis period. An additional dose maybe required. Later in this chapter we will adjust dosage regimens for reduced renal function according to Cpaverage or Cpmin/Cpmax requirements
Material on this website should be used for Educational or Self-Study Purposes Only
Copyright © 2001 - 2026 David W. A. Bourne (david@boomer.org)
 | A game to aid recognizing brand versus generic drug names See how many names you can catch before you run out of lives |
|